
Climate Corp - Field Health Advisor
The Climate Corporation
FIELD HEALTH ADVISOR DESIGN INITIATIVE
User Research | Conceptual Sketching | Interaction Design | Managed Visual Design
PROJECT BACKGROUND
The Problem: Provide farmers with targeted sub-field and field level insights and imagery that drive the ability to take actions
The users: Corn and soybean farmers
The Process:
Contextual Inquiries + interviews
Design Exploration
User Research
Detailed Design
THE STORY
Farmers have an unbearable amount of responsibilities. It is hard to put the stress and worry into words. They feed their children and the community, provide energy for our nation, and nurture our land for sustainability. All of this in a span of 5 months a year - for corn and bean that is.
Most farmers don't have conveniently located fields that make it easy to go out and tackle problems. Often, they are tens or even hundreds of miles away. The tension of tending to land on one end of the state versus the other becomes a game of chance with their livelihoods.
Satellite imagery isn't uncommon in the agriculture industry, but it is expensive and infrequent.
At Climate, my product team set out to change that. As the lead designer, I deepened our knowledge of farmers through a series of ethnographic research studies.
With this knowledge we defined the solution:
“Field Health provides farmers targeted sub-field and field insights and imagery that drive the ability to take actions. ”
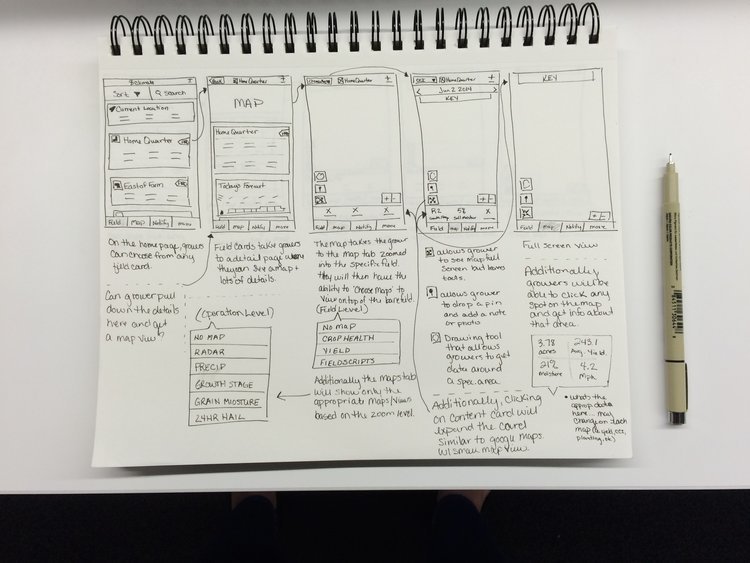
IDEA GENERATION
Embedded in the agile process, I hosted bi-monthly Design Jams where Engineers, PMs, QAs, BAs, and Scientists explored their ideas for the product.
Each Design Jam had a focal point using a 'How might we...' statement. Generated ideas were discussed, iterated, and evaluated to drive the design of Field Health Advisor.
ITERATION & TESTING
Defining image quality and frequency was a concern for our team. We wanted to make sure we provided the right imagery and data at the right time.
We used prototypes to test out different qualities of imagery as well as the tools interaction design.
We found that farmers needed the ability to normalize and rank the problem areas across their fields. This would allow them to determine which field needed more attention than the next. To support this, I implemented a view all version of Field Health Imagery coupled with notification when any of the fields hit a predefined threshold.
THE RESULT
Now that Field Health is implemented, I've heard great feedback from farmers. They can better identify problem areas within an individual field as well as compare that across their entire operation.
I'm happy to have removed at least a little stress in these farmer's lives.